Jennifer Chenowith
This is an emotional map of Austin made using participants’ responses to a 20 question survey, with questions like ‘where did you laugh the hardest’ and ‘where did you feel deep sadness’. We used X and Y coordinates to locate a place, with a Z point “up” for a positive experience and a Z point “down” for a negative experience. The map is color coded to a chart of emotions and generated in ArcScene, and was a collaboration with David Michael O’Donnell. The peak is Barton Springs at Zilker Park. When emotion is connected to location, location is no longer space, but place.
XYZ Atlas: The Hedonic Map of Austin
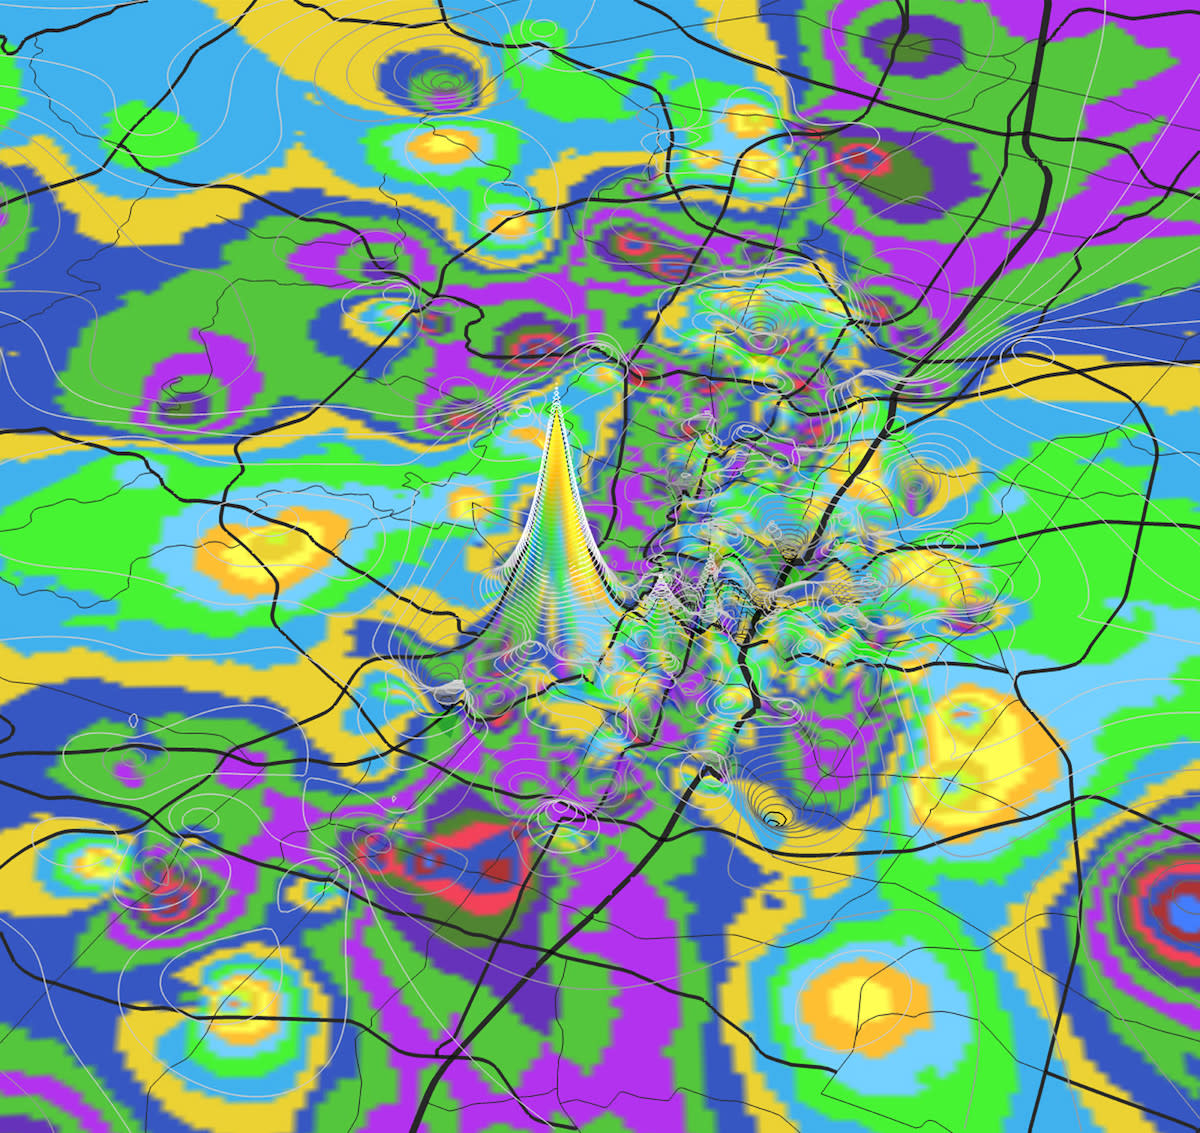
XYZ Atlas: The Hedonic Map of Austin (2016)
Jennifer Chenowith
Digital print on aluminum
36” x 36”
Location: 4th Floor near West (Atrium) escalator
No images match the filter results.